

Finding the best value stocks is similar to finding bargains at the grocery store or getting a sweet deal on a car.
However, with value stocks, the benefit of a discount isn't dollars in your pocket now — it's dollars in your pocket later, once the market realizes the stock's true value and drives the price higher.
That's how they're supposed to work, anyway.
Today, we'll explore the concept of value investing, including how it's defined, why investors are drawn to it, ways in which stocks are valued, and how to find the best value stocks to buy.
Ticker |
Company |
Analysts' consensus recommendation |
Forward P/E |
PEG ratio |
Dividend yield |
NXPI |
NXP Semiconductors |
1.80 |
14.1 |
0.73 |
1.7 |
RCL |
Royal Caribbean Cruises |
1.79 |
16.3 |
0.997 |
2.0 |
TMUS |
T-Mobile US |
1.63 |
14.3 |
0.803 |
2.3 |
CVX |
Chevron |
1.72 |
12.9 |
0.959 |
3.6 |
DVN |
Devon Energy |
1.30 |
8.65 |
0.961 |
2.8 |
COP |
ConocoPhillips |
1.64 |
12.8 |
0.855 |
2.7 |
CI |
The Cigna Group |
1.67 |
8.64 |
0.805 |
2.3 |
BAC |
Bank of America |
1.54 |
12.8 |
0.826 |
2.0 |
C |
Citigroup |
1.71 |
11.6 |
0.477 |
2.0 |
NRG |
NRG Energy |
1.59 |
11.7 |
0.502 |
1.6 |
FITB |
Fifth Third Bancorp |
1.76 |
12.5 |
0.87 |
2.8 |
CFG |
Citizens Financial Group |
1.61 |
12.3 |
0.50 |
2.5 |
SW |
Smurfit Westrock |
1.29 |
16.9 |
0.539 |
3.7 |
Ticker |
Company |
Analysts' consensus recommendation |
Forward P/E |
PEG ratio |
WFC |
Wells Fargo |
1.89 |
11.8 |
0.872 |
INTU |
Intuit |
1.86 |
12.6 |
0.833 |
HBAN |
Huntington Bancshares |
1.84 |
10.4 |
0.793 |
PNC |
The PNC Financial Services Group |
1.82 |
12.4 |
0.949 |
GM |
General Motors |
1.79 |
6.5 |
0.395 |
WTW |
Willis Towers Watson |
1.76 |
16.3 |
0.928 |
SCHW |
Charles Schwab |
1.73 |
14.9 |
0.735 |
CRM |
Salesforce |
1.67 |
14.2 |
0.877 |
KKR |
KKR & Co. |
1.59 |
16.5 |
0.803 |
NEM |
Newmont |
1.57 |
11.7 |
0.803 |
COF |
Capital One Financial |
1.54 |
10.0 |
0.986 |
NUE |
Nucor |
1.53 |
12.8 |
0.411 |
SNDK |
Sandisk |
1.48 |
6.0 |
0.14 |
MU |
Micron Technology |
1.41 |
6.0 |
0.035 |
VST |
Vistra |
1.35 |
15.5 |
0.42 |
DAL |
Delta Air Lines |
1.32 |
10.8 |
0.61 |
UAL |
United Airlines Holdings |
1.32 |
9.3 |
0.521 |
What are value stocks?
Value stocks are shares that trade for a lower price than what an investor thinks they should based on the company's underlying fundamentals.
That's the only real simplicity you'll get with them.
That's largely because of the next natural question: How exactly do you measure a stock's value?
There's no single answer to this question, nor even just a few answers. Financial minds have wizarded up literally dozens of metrics that can be used to determine a stock's value, and determine whether a stock is under-, fairly or overly valued.
However, virtually all valuation metrics have some sort of blind spot, and some are really only useful in measuring certain categories of equities.
It's typically best to use several metrics in concert when trying to identify value stocks.
Here are some of the most common valuation metrics:
Price-to-earnings (P/E):
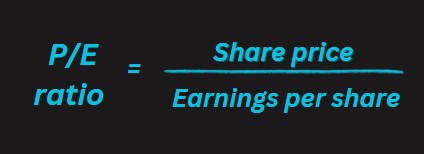
The price-to-earnings ratio — often referred to as P/E ratio — is calculated by dividing a stock's price per share by a 12-month period of earnings per share.
Typically, when someone simply says "P/E," they're referring to "trailing P/E," which uses the trailing 12 months' worth (aka the past four quarters' worth) of earnings. P/E is a quick-and-easy way to produce a value for a company based on hard, reported data that every company provides.
But it has a few issues. For one, the market is forward-looking, so valuing a stock based on what it's already done vs what it will do isn't necessarily useful.
It can't be used to value companies that are not currently profitable.
Like many valuation metrics, P/E isn't useful on its own — you'll typically want to compare it with a company's peers, its industry and/or a benchmark index like the S&P 500.
Forward P/E:
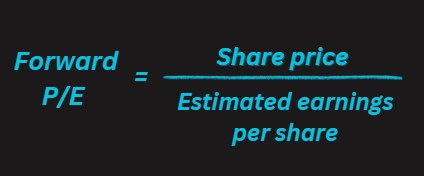
Forward P/E is similar to trailing P/E, except it uses earnings estimates for the E in the equation. On the one hand, you're dealing not with hard data, but merely analyst expectations.
On the other hand, instead of looking at what a company has already done, you're looking at what it might do in the future, which is more in line with where Wall Street's gaze is typically affixed.
Analyst expectations also tend to be accurate enough to make forward P/E useful. Forward P/E on its own isn't too helpful; instead, you'll want to compare it with peers or the broader market.
Price/earnings-to-growth (PEG):
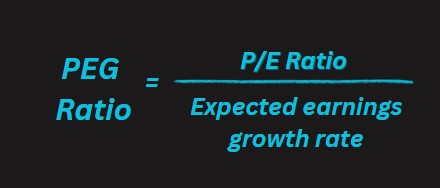
There is no perfect valuation metric, but PEG is one of the best. PEG takes a company's P/E (typically over the trailing 12 months), then divides that by its expected earnings growth rate, usually for the next five years.
The resulting number is evaluated through a system in which 1.0 is considered fairly valued, anything under 1.0 is considered undervalued and anything above 1.0 is considered overvalued.
PEG is a pretty useful metric because it factors in growth — based on, say, forward P/E, a utility stock might look much cheaper than a tech stock.
But once you also consider the expected growth you're buying, that utility stock might be expensive, and that tech stock might be a bargain.
You can use PEG on its own, but you can compare it with other PEGs. But like trailing and forward P/E, this doesn't work with companies that have no earnings.
Why do investors buy value stocks?
This question has a straightforward answer, at least.
Investors buy a value stock because they hope that, over time, other investors will begin to see the stock's intrinsic worth and buy up the stock, driving up the share price.
Also, like with any other classification of stock, investors also want the company's fundamentals to improve, further enticing investors to buy up shares.
We'll also note that, while it's hardly a rule, investing for value and investing for dividends frequently go hand in hand.
Growth stocks, which tend to be more expensive, frequently reinvest most if not all of their profits back into the business.
But slower-growth companies — the ones that tend to trade more in value territory — often use at least some of their cash to reward shareholders in the form of dividends.
How to find the best value stocks to buy
There are a variety of metrics you can use to find under-loved stocks. As you become more familiar with these statistics, we urge you to incorporate them in your own research.
But if you're looking for the best value stocks to buy today, we've put together a basic quality screen to help you start your search:
To get to our lists of the best value stocks to buy, we looked for companies:
Within the S&P 500: To be clear: Value stocks exist in all shapes and sizes.
But to start with, we'll look for underappreciated names in the S&P 500, which is made up of predominantly large-cap stocks and a small contingent of mid-cap stocks.
With a forward P/E of less than 17.0: At the very least, we want to find the best stocks to buy that are cheaper than the market.
Currently, the S&P 500 is trading at 19.9 times forward earnings estimates, so we need stocks trading at a P/E of less than that.
With a PEG of less than one: Our screen will only include stocks with a PEG of one or less, which means they're inexpensive by the technical definition of PEG.
With at least 10 covering analysts: We'd like to look at stocks that are on Wall Street analysts' radar, which makes it likelier that there's both more reporting and more insights on these companies.
The more stock research we have at our disposal, the more educated a decision we can make. Of course, because these are S&P 500 components, virtually all of them have a gaggle of analysts keeping tabs on them.
With a high-conviction consensus Buy rating: All the stocks must have an average broker recommendation of 1.8 or less within S&P Global Market Intelligence's ratings scale.
S&P Global Market Intelligence converts analysts' ratings into a numerical scale. Anything with a score of 2.5 or less is considered a Buy, while anything with a score of 1.5 or less is a Strong Buy – the highest designation.
By setting our bar at 1.8, we're ensuring all stocks included in the list are solidly in Buy territory at a bare minimum.
With a dividend yield of at least 1.5%: Because value investing and dividend investing often go hand in hand, we'll incorporate dividends into our screen.
We've set a yield bar of 1.5%, meaning all the stocks here offer at least a little bit more income than the S&P 500.
However, we recognize you might be dividend-agnostic. After the first group of stocks, you'll notice there's a second group of stocks produced by a screen that uses the same criteria above, but does not have a minimum yield (and doesn't require the stocks to pay a dividend at all).